
- Remaining Timing :-
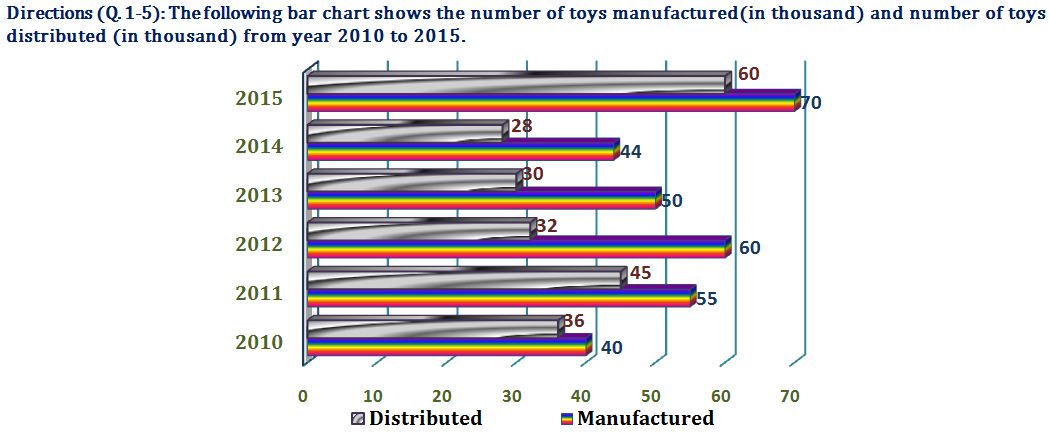
(1). The number of toys distributed in 2014 is what percentage of the number of toys distributed in 2012?
- (a). 80%
- (b). 82.5%
- (c). 87.5%
- (d). 90%
- (e). 96%
Answer : 87.5%
Explanation:
(2). Number of toys distributed in 2011 is how much percentage more than that of number of toys manufactured in 2010?
- (a). 12.5%
- (b). 16%
- (c). 20%
- (d). 22.5%
- (e). 25%
Answer : 12.5%
Explanation:
(3). How many years are there when the number of toys distributed is 75% or more of the number of toys manufactured in that year?
- (a). 1
- (b). 2
- (c). 3
- (d). 4
- (e). 5
Answer : 3
Explanation:
(4). In which year the percentage of distributed toys with respect to total produced toys of that year is minimum?
- (a). 2011
- (b). 2012
- (c). 2013
- (d). 2014
- (e). 2010
Answer : 2012
Explanation:
(5). What is the ratio between the sum of number of undistributed toys in 2010, 2011 and 2012 and sum of number of undistributed toys in year 2013, 2014 and 2015?
- (a). 7 : 5
- (b). 11 : 13
- (c). 17 : 16
- (d). 19 : 21
- (e). 21 : 23
Answer : 21 : 23
Explanation:
Recent Updates
ACHIEVER GALLERY

Result On Nov-2016

Result On Nov-2016

Result On Nov-2016
Word of Mouth
Feedback about SALEM

Feedback about ERODE

Feedback about DHARMAPURI